

A machine goes down in the middle of a shift. Maintenance gets called. Production waits. Orders slip. Everyone asks the same question: why did this happen now?
Most factory owners know this routine too well. The hard part is not knowing that problems exist. The hard part is seeing them early enough to act before they become expensive.
It is at this point that data analytics in manufacturing industry stops being a buzzword and starts becoming useful. It takes the signals already flowing through your operation: machine temperatures, cycle counts, downtime logs, scrap records, operator notes, ERP transactions, and turns them into decisions you can use on the floor.
You do not need a giant transformation program to begin. In many plants, the first wins come from using existing machine and business data better, then expanding only after the results are clear.
From Reactive Repairs to Predictive Power
A line supervisor hears an unusual vibration from a machine, but production is behind schedule and the job keeps running. Hours later, the machine stops. Now the team is not just fixing equipment. They are rescheduling labor, chasing parts, updating customers, and absorbing the cost of lost output.
That is reactive manufacturing. Many plants operate this way because information arrives too late, or it sits in too many places to be useful.
Data analytics changes the timing of the decision. Instead of asking what failed after the shutdown, you ask what signs appeared before it.
What the shift looks like on the floor
In practical terms, analytics means combining signals from machines, maintenance logs, quality checks, and production records so patterns become visible. A temperature drift that looks harmless on its own may matter when it appears alongside longer cycle times and repeated minor stoppages.
This represents significant value. You start catching relationships that people cannot reliably spot while managing a busy plant.
A useful way to think about analytics is this. Your factory is already talking. Data analytics helps you hear it sooner and more clearly.
Manufacturers are moving in this direction quickly. The global manufacturing data analytics market was valued at USD 7.5 billion in 2023 and is projected to reach USD 19.3 billion by 2032, with 40% of manufacturers prioritizing data analytics investments over the next 24 months to gain a competitive edge, according to DataIntelo’s manufacturing data analytics market report.
Why this matters beyond maintenance
This is not only about machines. The same logic applies to safety, quality, and planning. If you are interested in how leading indicators can reduce incidents before they happen, this guide to predictive safety analytics is worth reviewing.
For manufacturers exploring how to turn raw operational records into working dashboards and decision tools, these data analytics services show the kind of support model many firms use when they want to start without building everything internally.
What Is Data Analytics in Manufacturing
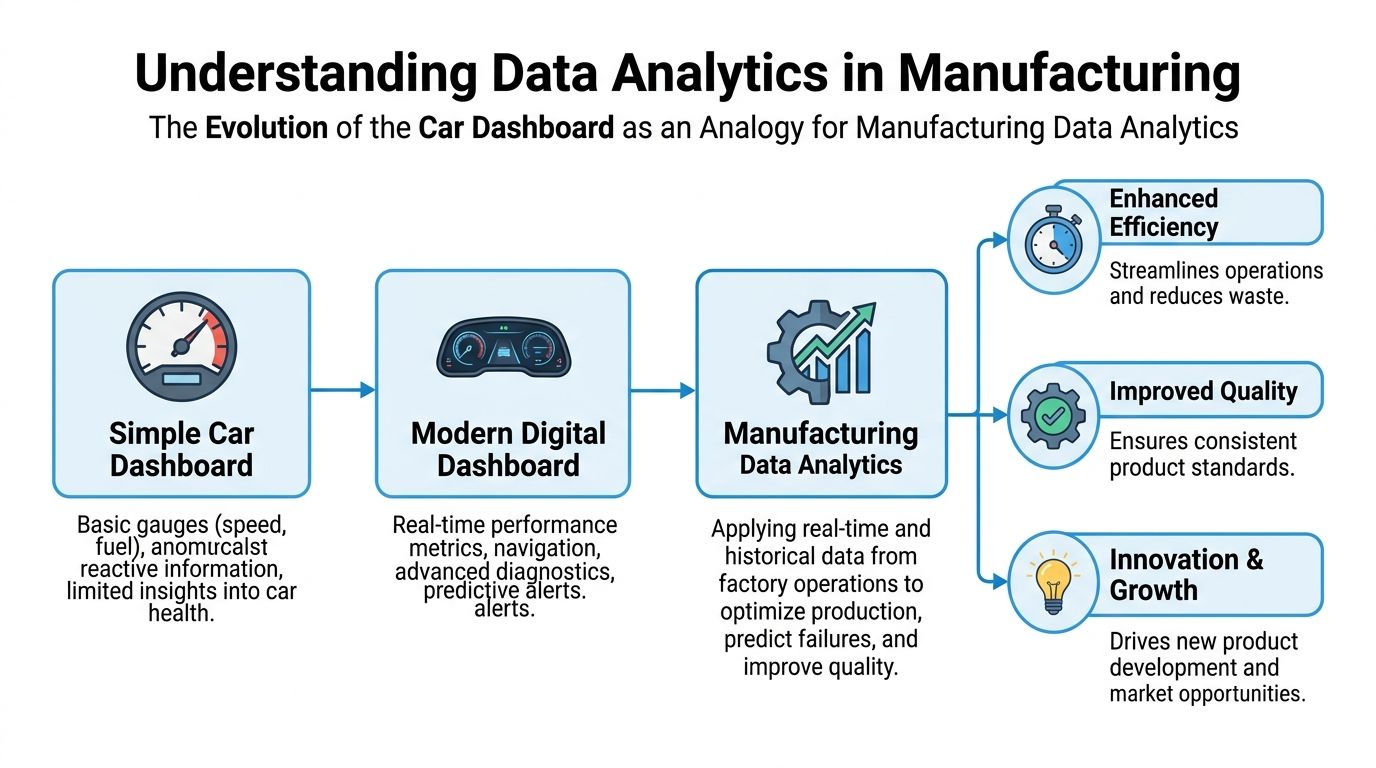
This topic is often overcomplicated. A simpler way to understand it is to compare your factory to a car dashboard.
A basic dashboard tells you what is happening right now. A better dashboard tells you what went wrong. A smarter one warns you what is likely to go wrong next. The most advanced one suggests what action to take.
That is the progression of manufacturing analytics.
Descriptive analytics
This is the starting point. It answers, what happened.
A plant manager looks at yesterday’s output, downtime by line, scrap by shift, and on-time completion. These reports do not predict anything. They create visibility.
If you have a production board, an ERP report, or an OEE dashboard, you are already doing descriptive analytics at some level.
Diagnostic analytics
This goes one step further. It answers, why did it happen.
Suppose Line 2 missed target output. Diagnostic analytics helps trace the reason. Was it changeovers? Material delays? A recurring fault on one station? Higher reject rates after a tool replacement?
At this stage, data from different systems begins to matter. A downtime log alone may not tell the full story. A downtime log connected to operator comments, lot history, and maintenance records often does.
Predictive analytics
This answers, what is likely to happen next.
A machine does not usually fail without warning. Bearings heat up. Vibration patterns change. Minor stops increase. Predictive analytics looks for those patterns in historical and real-time data.
For a non-technical owner, the plain-English version is simple. The system learns what trouble looks like before the breakdown happens.
Prescriptive analytics
This is the most advanced stage. It answers, what should we do about it.
A prescriptive system might suggest moving maintenance earlier, changing a machine setting, adjusting production sequencing, or rerouting work to another asset. The software does not replace your team’s judgment. It narrows the best next action.
Where readers often get confused
Many manufacturers hear “AI” and assume they need expensive automation, new machines, and a full IT overhaul. Usually they do not.
Start with the distinction below:
| Analytics type | Shop-floor question | Simple example |
|---|---|---|
| Descriptive | What happened | Output was below target on second shift |
| Diagnostic | Why did it happen | A filler station caused repeated stoppages |
| Predictive | What will likely happen | The motor is showing patterns seen before failure |
| Prescriptive | What should we do | Service the motor during planned downtime |
The point is not to jump to the most advanced stage on day one. The point is to build from visible facts to better decisions.
If your team cannot trust the basic numbers, advanced analytics will not help. Good manufacturing analytics starts with clean, practical data that operators and managers both recognize as real.
The Tangible Business Value of Shop Floor Data
A lot of manufacturers still treat data as paperwork in digital form. That mindset leaves money on the table.
Shop-floor data is an operating asset. When you use it well, it reduces waste, improves throughput, protects margins, and makes daily decisions less dependent on guesswork.
Where value shows up first
The first gains usually appear in ordinary, familiar problems:
- Chronic downtime: Small stops that never get analyzed together.
- Scrap and rework: Defects that seem random until process data shows a pattern.
- Missed delivery dates: Scheduling plans that ignore actual machine performance.
- Excess labor pressure: Teams firefighting because priorities keep changing.
- Inventory friction: Materials available on paper but not where production needs them.
None of these issues feels abstract to a factory owner. They affect the week’s shipments, customer confidence, and cash flow.
Why analytics improves profit, not just reporting
Without analytics, plants often argue about causes. With analytics, teams can test causes against evidence.
A line may look underperforming because operators are slow. The issue is extended startup loss after each changeover. Scrap may look like an operator problem. The data may show a recurring temperature drift tied to one tool path or one material batch.
That distinction matters. You do not improve margins by collecting more reports. You improve margins by acting on the right cause.
Consider how this plays out:
| Operational problem | What raw data reveals | Business impact |
|---|---|---|
| Frequent stoppages | Repeating fault patterns on one asset | More available production time |
| Inconsistent quality | Process drift before defects appear | Less scrap and rework |
| Poor schedule adherence | Actual cycle times differ from standards | Better planning and delivery reliability |
| High maintenance spend | Parts replaced too late or too early | Lower avoidable maintenance cost |
The hidden benefit owners notice later
Better data also improves conversations across departments.
Production stops blaming maintenance for every missed target. Maintenance stops getting vague work orders. Quality teams stop reacting only after defects pile up. Finance gets a clearer view of what is driving cost.
That alignment is hard to measure in a single line item, but it is one of the clearest signs that analytics is working.
For many manufacturers, the business case becomes straightforward once they see one pilot produce cleaner decisions. At that point, analytics no longer feels like an IT project. It becomes part of operations management.
Key Use Cases Transforming Production Lines
A factory owner usually feels these problems before seeing them on a dashboard. A press goes down in the middle of a rush order. Scrap climbs on one product line, but only on some runs. One shift consistently gets more output from the same equipment and crew.
Those are the moments where analytics earns its keep.
The strongest use cases in data analytics in manufacturing industry solve day-to-day production problems with data many plants already have. For small and mid-sized manufacturers, that often means starting with one line, one asset, or one recurring loss. Larger enterprises may connect more systems sooner, but the pattern is the same. Prove value on a focused use case, then expand.
Three use cases show up in almost every plant: predictive maintenance, quality control, and process optimization.

Predictive maintenance
Maintenance data works like an early warning system. Instead of waiting for a machine to fail, the team watches for small changes that usually appear first, such as rising vibration, abnormal temperature, longer cycle times, or repeated minor alarms.
Snowflake’s overview of analytics in manufacturing notes that manufacturers use predictive maintenance to reduce unplanned downtime, lower maintenance cost, and extend asset life through earlier intervention and better timing of service decisions. In practice, that means a plant can repair a problem on its schedule rather than the machine’s schedule, as described in Snowflake’s overview of analytics in manufacturing.
A CNC spindle is a good example. The spindle does not usually fail without warning. It degrades gradually. Operators may hear nothing unusual because the daily change is small. A simple model or even a well-set threshold can flag the drift early enough for maintenance to act during planned downtime.
That is why this use case often becomes the first pilot. The failure cost is easy to understand, and many plants can begin with alerts before investing in advanced AI tools.
AI-driven quality control
Quality issues rarely stay contained. One process setting slips, one material lot behaves differently, or one fixture wears unevenly. Defects then move downstream into assembly, packing, shipment delays, and customer complaints.
Analytics helps quality teams catch patterns earlier. Vision systems can inspect surface defects in real time. Process data can show whether reject rates rise after a setup, during a long run, or only with one supplier batch. Instead of treating quality as a final checkpoint, the plant starts controlling the process that creates the part.
For manufacturers building a stronger inspection and prevention system, this guide to quality assurance in manufacturing is a useful companion because it connects defect prevention to everyday production discipline.
Many owners assume this requires a fully automated smart factory. It does not. A smaller plant might start with one camera on one defect-prone station, then combine those findings with operator checks and machine settings. An enterprise may connect inspection, MES, and traceability data across multiple sites. Both approaches follow the same logic. Start where defects are costly and repeatable.
Process optimization
Some of the best returns come from improving a process that already runs every day.
Process optimization uses production data to answer questions operators and supervisors ask all the time. Why does Line 2 lose 18 minutes after each changeover when the standard says 10? Why does one operator consistently hit target cycle time without extra scrap? Why does output slow near the end of a run?
McKinsey describes digital and analytics programs in manufacturing as a way to improve throughput, yield, energy use, and labor productivity by making process losses visible and actionable, as outlined in McKinsey’s discussion of analytics and AI in manufacturing.
On the shop floor, this usually means combining several familiar data points:
- actual cycle time by product and shift
- setup duration by machine or crew
- scrap by material lot or recipe
- machine settings during good and bad runs
- operator inputs, downtime codes, or rework notes
Once those patterns are visible, supervisors can standardize the better method, planners can update unrealistic assumptions, and engineers can fix the process constraint instead of debating opinions.
This is also where existing business systems start to matter. If production data stays separated from order, inventory, and scheduling data, improvement efforts stall. Many manufacturers connect analytics with a cloud-based ERP for manufacturing so plant decisions reflect actual demand, material availability, and delivery commitments.
Digital twins and connected operations
Some larger manufacturers extend these use cases into digital twins and connected operations. A digital twin is a virtual model of a machine, line, or process that updates from real operating data. Engineers can test changes in the model before disrupting production on the floor.
For many SMEs, that should be a later step, not the starting point.
A practical rollout is usually phased. First, solve one downtime issue. Next, add quality data where scrap is highest. Then connect process and planning data to improve throughput across the line. That approach helps manufacturers avoid large upfront spending before the return is proven.
The best use case is the one your team can act on within normal operations, then repeat in the next area with confidence.
Building Your Manufacturing Data Architecture
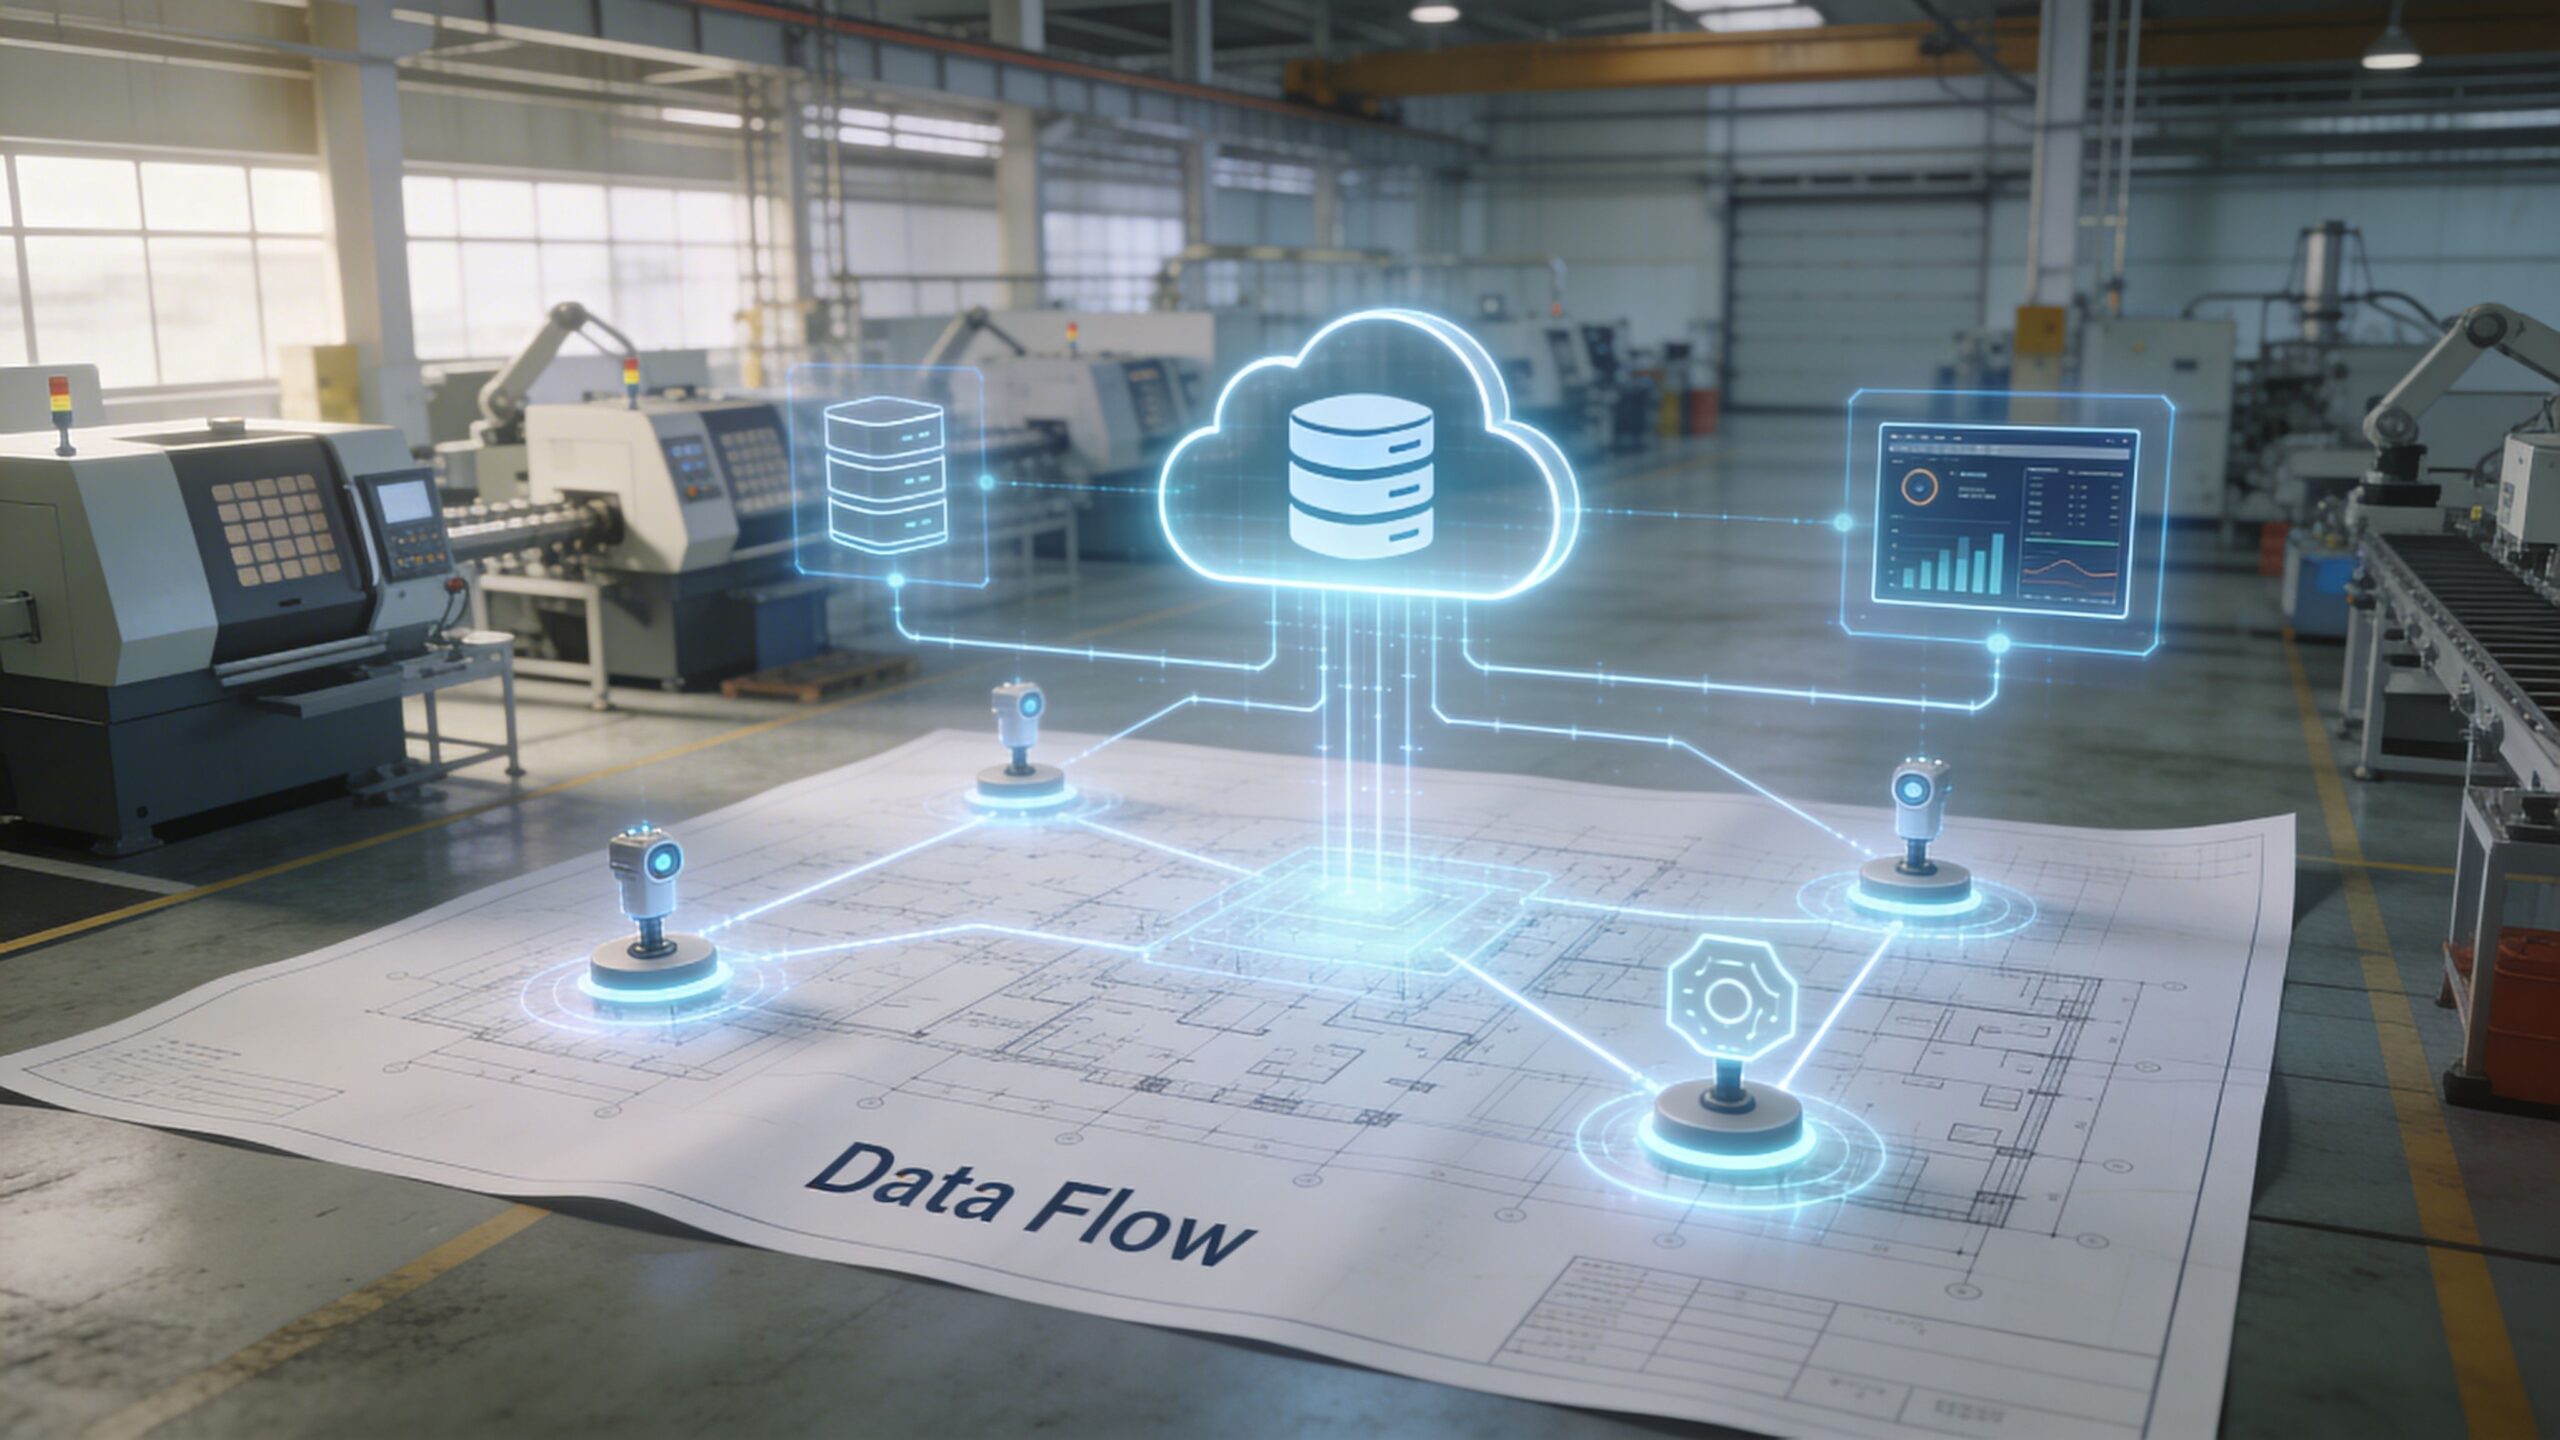
The phrase “data architecture” sounds more technical than it needs to be. In a factory, it means how data moves from equipment and systems into a form people can use.
If the flow is broken, dashboards become unreliable and analytics projects stall.
Start with the sources
Most manufacturers already have more data than they think. The issue is not total volume. It is fragmentation.
Common sources include:
- Machines and controls: PLCs, CNC controllers, robotics systems, and sensor outputs.
- Supervisory systems: SCADA or HMI environments that track conditions and events.
- Manufacturing systems: MES records for work orders, production status, and traceability.
- Business systems: ERP, purchasing, inventory, and customer order data.
- Human inputs: Shift logs, quality checks, maintenance notes, and spreadsheets.
A useful architecture does not require every source on day one. It requires choosing the sources tied to the problem you want to solve.
Then build the path
The next step is collection and connectivity. Some assets already produce usable data. Older machines may need add-on sensors, gateways, or manual capture at first.
The basic flow looks like this:
| Layer | What it does | Typical example |
|---|---|---|
| Data source | Generates operational or business data | PLC, ERP, quality record |
| Collection | Pulls or receives the data | Gateway, connector, API |
| Storage | Holds data for analysis | Cloud database or data lake |
| Processing | Cleans and organizes the data | ETL workflow, rules engine |
| Visualization | Shows insights to users | Power BI, Tableau, custom dashboard |
At this stage, many manufacturers make a costly mistake. They buy a dashboard tool before fixing data definitions. If one system defines downtime one way and another defines it differently, the dashboard only makes the confusion easier to see.
Cloud, on-premise, or hybrid
There is no universal answer. Some plants keep sensitive workloads on-premise. Others prefer cloud because it simplifies scaling and remote access.
Cloud-based manufacturing systems are often attractive because they can connect data across plants and business functions without requiring a heavy in-house infrastructure build. Manufacturers evaluating that path often look at how a cloud-based ERP for manufacturing can connect inventory, planning, production, and finance into one operating picture.
Keep the design practical
A strong architecture for a mid-sized manufacturer usually has these traits:
- Focused: Built around a business use case, not abstract IT ambition.
- Compatible: Able to work with older equipment and newer systems together.
- Governed: Clear definitions for downtime, scrap, cycle time, and other core terms.
- Accessible: Operators, supervisors, and leaders can all use the outputs.
- Expandable: The first pilot does not block later growth.
The goal is not elegance for its own sake. The goal is dependable data that people trust enough to use in production decisions.
An Implementation Roadmap for Manufacturers
The biggest mistake manufacturers make is trying to do too much at once. They hear “Industry 4.0,” approve a pilot, install a few tools, and then wonder why the effort never spreads beyond one line.
That pattern is common. A World Economic Forum study found that only 39% of manufacturing executives have successfully scaled data use cases, while SMEs often struggle with legacy integration and skill shortages. The same verified brief notes that a phased approach and strategic partnerships are critical for realizing potential 10% EBITDA gains without heavy upfront cost, as summarized in the World Economic Forum discussion of manufacturing data and advanced analytics.

People first
Analytics projects fail when they are treated as software rollouts instead of operating changes.
Operators worry they are being monitored instead of supported. Maintenance teams worry that a model will overrule experience. Managers ask for dashboards nobody uses in daily meetings.
A better approach is to involve the people who live with the problem.
- Pick one operational owner: The project needs a plant-side leader, not just IT participation.
- Use the language of the floor: “Reduce nuisance stops on Press 4” works better than “deploy predictive analytics capability.”
- Train for decisions, not theory: Supervisors need to know what action a signal should trigger.
- Protect credibility: If early dashboards show numbers the floor knows are wrong, trust drops fast.
Fix the process before scaling the platform
Many recurring problems are partly data problems and partly process problems.
If maintenance codes are inconsistent, the analytics will be weak. If shift handoff notes are incomplete, root-cause work will stay fuzzy. If cycle-time standards have not been updated, planning analytics will keep misleading the team.
That is why the early phase should tighten process discipline while building the technical layer.
A simple phased model works well:
Identify one pain point
Choose a problem with clear operational and financial relevance. Downtime, scrap, changeover loss, and schedule adherence are common starting points.Audit available data
List what already exists in PLCs, MES, ERP, CMMS, spreadsheets, and manual logs. Most plants discover they can start with more than they expected.Create one shared metric definition
Agree on what counts as downtime, defect, completed unit, and planned versus unplanned event.Build a pilot around action
A pilot should produce a decision, not just a chart. If the output does not change maintenance timing, quality response, or scheduling behavior, it is not finished.Review weekly with operations
The best pilot governance is a short recurring review tied to plant performance, not a detached technical committee.
Build the platform in layers
The platform should follow the problem, not the other way around.
For SMEs, that often means starting with a small set of connected assets and one dashboard. For larger enterprises, it may mean building a common data model across multiple plants so results can scale.
A practical sequence looks like this:
| Phase | SME focus | Enterprise focus |
|---|---|---|
| Pilot | One line, one use case, existing data where possible | One plant, one standard use case, governed model |
| Expansion | Add more machines or one adjacent use case | Replicate across lines and plants |
| Integration | Connect analytics to ERP, maintenance, quality workflows | Standardize across business systems |
| Scaling | Build repeatable operating cadence around dashboards | Create enterprise-wide standards and governance |
Manufacturers that want a structured view of where they stand often use a data maturity model to assess whether they are still reporting the past, diagnosing root causes, or using data to guide forward-looking decisions.
Why a US-based outsourcing partner helps
Small and mid-sized manufacturers often know what they want to improve. What they lack is the spare bandwidth to connect systems, clean data, build dashboards, and maintain the work after launch.
A USA-based outsourcing partner can help in a practical way. You get easier communication during business hours, stronger alignment with local operating expectations, and a partner who can bridge plant leadership with technical execution. That is especially useful when your internal team is strong on manufacturing but thin on data engineering, cloud setup, reporting design, or ongoing support.
For enterprises, the value is different. A partner can speed up rollout across locations, help enforce data standards, and handle the repetitive build work that internal teams do not have time to absorb.
The key is not outsourcing strategy. It is outsourcing execution around a strategy your plant owns.
Start with a business problem that hurts every week. If the project solves that visibly, your team will ask for the next phase on its own.
Measuring Success with the Right KPIs
A factory owner usually knows when a project is helping. Fewer rush repairs. Less arguing about the cause of scrap. Better confidence in what tomorrow's shift will produce.
KPIs turn that gut feel into proof.
If you cannot show that a pilot reduced downtime, improved first pass yield, or shortened changeovers, the work gets labeled as reporting instead of improvement. That matters even more in a phased rollout. Small wins are what earn budget for the next phase, especially if you are starting with existing machine, quality, or ERP data instead of a large Industry 4.0 program.
Choose KPIs by the business problem
Do not give every analytics project the same scorecard. A maintenance pilot and a scheduling pilot should not be judged by identical numbers.
Match the KPI to the decision your team wants to improve.
If the problem is unplanned stoppages, track reliability and recovery. If the problem is quality drift, track yield and defect patterns. If the problem is missed delivery dates, track schedule performance and cycle-time accuracy. The point is simple. Every KPI should answer one practical question: what decision will improve if this number changes?
Here is a practical KPI set.
| KPI | What It Measures | Impact Area |
|---|---|---|
| OEE | Availability, performance, and quality combined | Overall operational effectiveness |
| Unplanned downtime | Time lost to unexpected stoppages | Maintenance and asset reliability |
| Mean time between failures | Time between equipment breakdowns | Reliability improvement |
| Mean time to repair | How long recovery takes after failure | Maintenance responsiveness |
| First pass yield | Share of units that pass without rework | Quality performance |
| Scrap rate | Material or units lost to defects | Waste reduction and margin |
| Throughput | Good units produced in a period | Capacity and output |
| Schedule adherence | How closely production matches plan | Planning and delivery performance |
| Changeover time | Time required to switch jobs or products | Flexibility and productivity |
| Labor productivity | Output relative to labor input | Workforce effectiveness |
Start with a small scorecard
Many plants make the same mistake. They launch a dashboard with twenty metrics, then review none of them with discipline.
Start with three to five KPIs tied to one use case. That is usually enough for a pilot. A packaging line maintenance project might track unplanned downtime, mean time between failures, and mean time to repair. A quality project on a machining cell might track first pass yield, scrap rate, and defects by machine or shift.
This works like a machine control panel. Operators do not need every signal on one screen. They need the few readings that help them act before the process drifts too far.
What a useful dashboard shows
A useful dashboard helps a supervisor move from "something is off" to "here is where to look."
That means three things:
- Show trends over time, not just today's number
- Separate plant-level metrics from line, machine, or shift detail
- Assign an owner and an expected response for each KPI
For example, if first pass yield drops from its normal range, the dashboard should help the team check whether the issue is concentrated on one machine, one operator group, one material lot, or one product family. That is where analytics starts paying for itself. It shortens the path from symptom to action.
Review cadence matters as much as the metric
A KPI no one reviews is just decoration.
Weekly reviews are often the right pace for a new analytics initiative. They are frequent enough to catch patterns and slow enough to let the team test a response. Daily reviews can work for highly sensitive processes, but many plants create noise when they react to every small fluctuation. Monthly reviews are usually too late if the goal is to guide operations.
For SMEs, this discipline keeps the effort manageable. For larger enterprises, it creates a repeatable operating rhythm that can be used across sites without forcing every plant into the same maturity level on day one.
The best KPI system is the one your team uses consistently, trusts, and ties to clear plant actions.
Start Your Smart Manufacturing Journey Today
Most manufacturers do not need more theory. They need a sensible starting point.
The smartest approach is usually the least dramatic one. Pick one problem. Use the data you already have. Define success clearly. Run a pilot that changes an actual plant decision. Then expand only after the result is visible.
That is how data analytics in manufacturing industry becomes manageable. Not as a giant technology program, but as a series of practical operating improvements.
If you run an SME, this phased model protects cash and reduces risk. If you run a larger enterprise, it creates a repeatable way to scale across plants without forcing every location into a costly overhaul at once.
A USA-based outsourcing partner can make that journey easier by supplying the technical depth, reporting support, and implementation discipline that many internal teams do not have time to build on their own. The benefit is speed without losing operational control.
You do not need perfect systems to begin. You need one clear business problem, one accountable owner, and one data path your team can trust.
NineArchs LLC can help manufacturers move from scattered data to a practical rollout plan with flexible technology and outsourcing support. If you want help building a phased analytics roadmap, modernizing cloud and reporting workflows, or extending your team with specialized talent, contact NineArchs LLC at (310)800-1398 / (949) 861-1804 or email info@ninearchs.com.